

Theme Park Business Plan Template
Theme Park Business Plan Template
A capital-intensive venture that rewards the founders who plan down to the ride inspection schedule. Download the free template or let our consultants build the full investor package.

SBA Funding & the Theme Park Investment Landscape
Theme parks sit at the intersection of real estate, entertainment, and hospitality, three asset classes that lenders understand, provided the business plan demonstrates sustainable cash flow at realistic attendance levels. Securing debt for this niche requires knowing which programme fits which scale of project.
SBA 7(a) Loans, NAICS Code 713110 (Amusement and Theme Parks)
Businesses with annual revenues under $47 million qualify as small businesses under SBA size standards for NAICS 713110, making them eligible for SBA 7(a) loans of up to $5 million with terms up to 25 years. The SBA does not lend directly, it guarantees up to 85% of loans under $150,000 and 75% of loans above that amount, which reduces lender risk and typically means better rates than conventional commercial debt.
For theme park startups, SBA 7(a) funds are most commonly used for: land acquisition or long-term lease improvements, ride and attraction purchases, construction and fit-out, and 6-12 months of working capital. The SBA 504 loan programme (up to $5.5M, fixed-rate, paired with a Certified Development Company) is better suited to fixed asset purchases, particularly land and permanent structures.
SBA lenders reviewing NAICS 713110 applications focus heavily on: debt service coverage ratio (DSCR) of at least 1.25x, evidence of management team hospitality/operations experience, a catchment area analysis showing sufficient drive-time population, and a credible break-even timeline typically under 36 months.
USDA Business & Industry Loan Guarantee
For theme parks sited in rural or small-town locations (populations under 50,000), the USDA Business & Industry (B&I) Loan Guarantee Programme offers guarantees up to 80% on loans up to $25 million. Rural tourism businesses, including adventure parks, family entertainment centres, and seasonal attraction parks, have successfully accessed B&I funding where SBA limits would constrain the project. The trade-off is a more complex application and a 90-day+ processing timeline.
UK Funding Routes
In the UK, the Start Up Loans scheme (up to £25,000 at 6% fixed, backed by the British Business Bank) can cover early feasibility, planning costs, and small-scale FEC launches. For larger theme park projects, funding typically comes from a combination of: commercial mortgage (50-65% LTV on the land/property), equipment finance or asset-based lending for rides, and either private equity or SEIS/EIS angel investment. The UK Shared Prosperity Fund and regional growth funds have supported leisure destination projects in Enterprise Zones, with grants of £50,000-£500,000 in some cases. Planning to tap these requires your business plan to demonstrate local employment creation and visitor economy impact.
The Theme Park Market in 2025, Size, Growth & Opportunity
The global theme park market was valued at $67.85 billion in 2025 and is forecast to reach $110.50 billion by 2033, growing at a 6.3% compound annual rate, according to Grand View Research. The broader amusement parks category, which includes water parks, family entertainment centres, and seasonal attractions, is valued separately at over $106 billion in 2025 by the same firm.
Asia Pacific commands the largest regional share at 37.9% of global theme park revenue in 2025, driven by continued investment in China, South Korea, and Japan. North America remains the highest-value market per attendance, with US parks averaging $142 in total revenue per visitor, a figure that reflects not just gate income but in-park food, merchandise, and premium add-ons that now represent 40-50% of operator revenue.
The demand recovery since 2021 has been broad-based, but the structural shift worth noting is the outperformance of immersive, IP-anchored experiences. Lost Island Theme Park in Iowa, a new park that opened in 2022 with more than $100 million in development investment, built its identity around proprietary themed lands rather than off-the-shelf ride catalogues. That model, where theming creates repeat visitation, is increasingly what institutional investors and regional lenders look for in a business plan.
For smaller and regional operators, the opportunity lies in the drive-to market: US consumers who will travel 60-90 minutes for a family day out but not 4+ hours to a mega-destination. A well-positioned regional park with a clearly defined catchment population of 1-2 million people within a 90-minute drive can build a sustainable business on 80,000-200,000 annual visitors without needing the capital base of a national operator.
UK Market Context
The UK theme park sector is dominated by Merlin Entertainments (Alton Towers, Thorpe Park, Chessington, Legoland) and a spread of independent and charity-operated regional parks such as Drayton Manor, Paultons Park, and Flamingo Land. The independent sector is characterised by tight capacity constraints, most UK sites operate under planning permissions that cap attendance, and a strong focus on season pass revenue to smooth the school holiday demand spike. New entrants with a credible site, distinctive concept, and an ADIPS-compliant ride fleet can still capture meaningful market share in regions underserved by existing operators.
For detailed context on the broader hospitality and entertainment sector that encompasses theme parks, see our amusement park business plan template and entertainment venue business plan guide.
A capital-intensive sector needs an investor-grade plan. We can write it.
We handle research & narrative, investor-ready copy in 3-4 days
Get StartedFull plan + 5-year forecast + ride-by-ride CAPEX schedule, 10-14 days
Book a CallCapital Requirements by Scale, What Theme Parks Actually Cost to Build
The most important question in a theme park business plan is not "how much do I need?" but "what scale of park does my available capital support?" Getting this wrong, budgeting for a small FEC but trying to compete as a regional destination, is how most early-stage projects fail at the funding stage.
Scale Tiers and Investment Ranges
| Scale | US Investment Range | UK Equivalent | Annual Attendance | Typical Rides |
|---|---|---|---|---|
| Small FEC / Indoor | $500K-$3M | £400K-£2.4M | 20,000-80,000 | 3-8 family rides + soft play |
| Small Outdoor Park | $3M-$20M | £2.4M-£16M | 50,000-150,000 | 5-15 rides, outdoor setting |
| Regional Destination Park | $20M-$150M | £16M-£120M | 150,000-800,000 | 15-40+ rides, theming, F&B village |
| Major Destination Park | $150M-$2B+ | £120M-£1.6B+ | 1M+ | 40+ rides, hotels, IP licensing |
For context: Lost Island Theme Park in Iowa, which opened in 2022 as a mid-scale regional park, had total development costs exceeding $100 million. A small outdoor park with 7-10 rides in a mid-sized US city typically runs $5M-$12M in total capitalisation, with land representing 15-25% of that figure depending on whether it is purchased or held on long-term lease.
Detailed Cost Breakdown, Small-to-Mid Outdoor Park ($5M-$20M Range)
- Land acquisition or long-term ground lease: $500K-$5M (£400K-£4M), lease structures are strongly preferred by lenders for first-time operators, reducing upfront CAPEX and concentrating equity on operating assets
- Rides and attractions (per ride, delivered and installed): $50K-$5M per ride depending on complexity; a minimum viable mix of 5-7 rides for a small outdoor park typically costs $800K-$4M
- Construction, site grading and themed landscaping: $500K-$8M, this is the most variable line item; theming adds 20-40% to base construction cost
- Food and beverage village fitout and equipment: $100K-$1M depending on number of outlets and kitchen specification
- Ticketing, access control, point-of-sale and RFID wristband systems: $50K-$350K, Accesso, Gateway Ticketing, and Sievert are the leading suppliers for regional parks
- Electrical infrastructure, water, drainage and utilities: $150K-$2M for sites requiring new utility connections
- Safety certification and pre-opening inspections (ASTM F24 / state permits): $25K-$150K, often underbudgeted; add $5K-$20K per ride for annual recertification
- Pre-opening marketing, website and group sales programme: $50K-$400K, season pass pre-sales launched 6-12 months before opening are the single most effective cash flow tool
- Working capital for first 12 months of operation: $300K-$2.5M, sized to cover the winter operating loss and the ramp to break-even attendance
- Public liability, employer, and property insurance (annual): $40K-$500K depending on attendance projections and ride count
Phased Opening Strategy
Most lenders and investors favour a phased CAPEX model over a single large build. Phase 1 opens with 4-6 core attractions, enough to justify a $20-$35 admission price, and generates operating cash flow that funds Phase 2 ride additions. This approach: (a) reduces total day-one debt, (b) gives the business real attendance data to support refinancing or equity raises, and (c) creates a press event each season when a new ride launches. Cedar Fair's model of adding one major new attraction per park per year at a cost of $5M-$25M is the institutional version of the same strategy.
Funding the Build
A typical small-to-regional park capital stack looks like this: 20-30% founder equity or family/angel investment, 50-60% SBA 7(a) or 504 debt (NAICS 713110), and 10-20% equipment finance or asset-based lending on the ride assets specifically. In the UK, the structure is more commonly: 30-40% equity, 40-50% commercial mortgage on the site, and 10-20% equipment finance or asset finance on the ride fleet. Our bespoke business plan service includes a capital structure recommendation alongside the financial model, because the right stack affects your DSCR, bank covenants, and equity return profile.
Revenue Model & Unit Economics for Theme Park Operators
Gate admission is the headline number that founders quote, but in practice it rarely covers operating costs on its own. The revenue model that investors and lenders stress-test is the blended per-visitor yield across all revenue streams, because this determines whether the park can service debt, fund capex reinvestment, and generate equity returns simultaneously.
Revenue Streams by Category
- Gate admissions and day tickets: $15-$60 at small parks; $80-$140 at large destination parks. Discount structures (online pre-booking, group rates, evening tickets) affect yield but increase attendance fill rates
- Season passes and annual memberships: Typically priced at 2.5-4x the single-day gate. Season pass holders visit 4-6 times per year, making them 3-5x more valuable per head than day visitors on an annualised basis
- Food and beverage: $12-$28 per visitor at well-run parks; F&B typically generates 20-28% gross margin after COGS. All-inclusive dining add-ons (meal plans) are growing rapidly, especially when bundled with season passes
- Merchandise and retail: $5-$18 per visitor; highest at parks with exclusive IP or custom-branded products visitors cannot purchase elsewhere
- Premium experiences: Fast passes, VIP tours, character encounters, and special event nights ($20-$100 per transaction), this is the fastest-growing revenue category and requires almost no additional capital once the park infrastructure exists
- Private event hire: Corporate team days, school group packages, birthday party packages. A regional park with meeting room or outdoor event space can generate $5,000-$50,000 per event and fill weekday capacity that would otherwise sit empty
- Sponsorships and naming rights: Regional parks can generate $25K-$500K/year in branded sponsorship of specific attractions or event programmes
- Hotel and accommodation partnerships: For parks large enough to warrant overnight visitors, on-site or partner accommodation can add 20-35% to per-visitor yield
Worked Unit Economics Example, 10-Acre Regional Park, Tennessee
A 10-acre outdoor park near Nashville with 7 rides, a splash pad, and an F&B village targets 120,000 annual visitors in Year 3 at 82% of capacity. Admission pricing: $35 standard gate, $28 for online pre-booking (which accounts for 60% of admissions). Average in-park per capita spend across all categories: $22 (food $14, merchandise $5, premium add-ons $3). This produces:
Operating costs at this scale: staffing 40-45% of revenue (seasonal headcount peaks at 120-180 employees in summer, drops to 15-25 in winter), ride maintenance and safety inspection 8-10%, utilities and insurance 6-8%, marketing 5-7%, food COGS 12-14%. After these and debt service on a $5M SBA loan at 6.5% over 20 years ($5,400/month), EBITDA reaches approximately $1.5M, a 22% margin, with net profit after interest and depreciation around $900K.
The path to margin expansion is season pass penetration. If 15% of Year 3 visitors hold season passes (at $95/year), the average revenue per pass-holder rises to $190 annually (5 visits × $38 blended daily spend including entry). Increasing season pass penetration to 30% in Year 5 reduces per-visitor acquisition cost and increases predictable forward-booking revenue, which banks and refinancing lenders weight heavily.
For a full financial model with monthly cash flows, break-even analysis, and a 5-year projection tailored to your site and scale, see our Research + Content package or the Bespoke Business Plan.
Three Theme Park Business Models, Choosing the Right One for Your Plan
The business plan structure, investor pitch, and regulatory pathway differ substantially depending on which model you are building. Most first-time founders default to the model they have personally visited most often, which is usually a major destination park, when their capital and market actually support a much smaller format. Getting this right at the planning stage saves years of repositioning.
| Model | Family Entertainment Centre (FEC) | Small Regional Outdoor Park | Destination Theme Park |
|---|---|---|---|
| Capital Required (US) | $500K-$5M | $5M-$50M | $50M-$2B+ |
| Typical Site Size | 3,000-30,000 sq ft (indoor) or 1-3 acres (outdoor) | 5-30 acres | 50-500+ acres |
| Primary Revenue Driver | Per-session admissions + F&B; parties and group bookings | Season passes + gate admissions + in-park spend | IP licensing, hotel/resort revenue, in-park spend at scale |
| Biggest Planning Risk | Location selection and foot traffic, wrong site kills an FEC | Seasonal cash flow cliffs; single-site concentration risk | Planning/EIA timelines; cost overruns; IP deal complexity |
| Primary Lender / Funder | SBA 7(a), commercial bank, equipment finance | SBA 7(a)/504, commercial mortgage, angel/family office | Private equity, institutional debt, municipal bonds (US) |
| Break-Even Timeline | 12-24 months | 18-36 months | 3-8 years |
| Examples | Sky Zone, Altitude Trampoline Park, local adventure golf | Lost Island (Iowa), Woodlands Family Theme Park (Devon UK), Paultons Park (UK) | Universal Studios, Cedar Point (Cedar Fair/Six Flags), Alton Towers (Merlin) |
The comparison above matters for your business plan because lenders calibrate risk differently across these models. FECs are underwritten like retail commercial leases, location and foot traffic data dominate. Small regional parks are underwritten more like hospitality assets, cash flow modelling with seasonal patterns and a management team track record. Destination parks require institutional-grade due diligence and rarely fall within SBA programme limits. Most Avvale clients in this sector are building FECs or small regional parks, where our $300 Research + Content and $1,000 Bespoke Plan packages produce the financial models and narrative that meet lender requirements. See also our free business plan templates library for sector-adjacent guides.
Licensing, Safety Certification & Compliance, The Detail That Kills Underprepared Plans
Theme park licensing is more granular than most hospitality businesses. It is not a single licence but a stack of overlapping certifications, ride-by-ride, outlet-by-outlet, and site-wide, that must be obtained in the correct sequence before you can accept a paying visitor. Plans that underestimate the timeline and cost of this stack routinely delay opening by 6-18 months.
United States, Federal and State Requirements
- ASTM F24 Committee Standards (Amusement Rides and Devices): Voluntary at the federal level but adopted by statute in 38 states. Standards cover ride design, manufacturing, testing, daily inspection protocols, operator training, and incident reporting. Annual third-party inspection by a certified engineer costs $500-$5,000 per ride depending on complexity
- State Amusement Ride Safety Permit: Required in most states before any ride operates commercially. California DOSH (Department of Occupational Safety and Health) runs one of the toughest programmes, mandatory third-party engineering audits, annual permits, and 24-hour incident reporting. New Jersey's Carnival-Amusement Ride Safety Act requires non-destructive testing (NDT) on critical structural welds at intervals stricter than ASTM F24 baseline. Florida requires an annual affidavit of compliance executed by a professional engineer. Allow $10,000-$100,000 in total regulatory fees at opening for a 7-15 ride park
- Zoning and Special Use Permit: Outdoor parks almost always require a Special Use Permit or Conditional Use Permit from the county or municipality. Expect a public hearing, a traffic impact study, and a drainage/stormwater plan. Timeline: 3-9 months minimum
- Environmental Impact Assessment: Required for new construction on undeveloped land, particularly if the site is near wetlands, floodplains, or protected habitat. Cost: $15,000-$150,000; timeline: 6-18 months. This is the single most common cause of catastrophic delay in US theme park projects
- Food Establishment Permit: Each F&B outlet requires a separate county health department permit. Staff must hold food handler certifications (ServSafe in most states). Annual renewal with unannounced inspections
- Business Licence and EIN: State and local business licence ($500-$5,000); federal Employer Identification Number via IRS (free, instant online)
United Kingdom, Planning, HSE and Operational Compliance
- Planning Permission (Local Planning Authority): New outdoor theme parks require full planning permission, which for larger sites triggers an Environmental Impact Assessment under the EIA Regulations 2017. Application fees range from £462 to over £25,000 depending on scale. Professional planning consultant and architect fees add £5,000-£40,000+. Standard applications take 8-13 weeks; major developments typically take 12-24 months including the EIA process. The HSE's HSG 175 guidance publication (Fairgrounds and Amusement Parks) is the operational bible
- ADIPS (Amusement Device Inspection Procedures Scheme), Declaration of Operational Compliance (DOC): Each ride must hold a current DOC issued by an ADIPS-registered Inspection Body before it can operate commercially. Annual inspection cost: £300-£1,200 per ride. Operating without a valid DOC is a criminal offence under PUWER (Provision and Use of Work Equipment Regulations 1998). The HSE in July 2025 publicly suspended nine rides at Woodlands Family Theme Park in Devon due to missing DOCs, a real-world reminder of the compliance stakes
- Premises Licence (Licensing Act 2003): Required for regulated entertainment (live and recorded music, late-night refreshment). Initial fee: £635-£1,905 based on rateable value; annual renewal: £320-£4,385. 28-day statutory consultation period during application
- Food Business Registration: All food businesses must register with the local authority at least 28 days before opening. Registration is free but triggers unannounced EHO inspections and the Food Hygiene Rating Scheme scoring (5-star target)
- Public and Employers Liability Insurance: No statutory minimum for public liability, but £5-10M is standard. Employers liability: £5M statutory minimum under the Employers' Liability (Compulsory Insurance) Act 1969. Annual premium: £5,000-£200,000 depending on attendance, ride count, and operator history
- DBS Checks for Staff in Regulated Activity: Theme parks employing staff who work directly with children must ensure those staff have enhanced DBS clearance. Applies to seasonal staff as well as permanent employees
International, EU and Australia
- European Union: EN 13814 standards govern amusement rides (European equivalent of ASTM F24). CE marking required for machinery under the EU Machinery Directive. Germany requires TÜV or DEKRA annual inspection and a state-level operating licence (Gewerbegenehmigung); France and Netherlands have similar national certification programmes
- Australia: AS 3533 Amusement Rides and Devices standard; accredited engineer annual inspection required in each state. Queensland's Safety in Recreational Water Activities Act 2011 applies to water-based attractions. Australian Business Number (ABN) registration via ATO; state business licence required in most jurisdictions
Download Your Free Theme Park Business Plan Template
Structured for capital-intensive entertainment ventures, free Word doc, yours in 30 seconds.
Six Costly Planning Mistakes That Derail Theme Park Projects
These are not hypothetical errors. Each of the following appears repeatedly in the business plans that come to Avvale for rescue after a funding rejection or a planning stumble.
- Seasonal cash flow is modelled as an average, not a spike. Most outdoor parks generate 60-70% of annual revenue in June-August. A business plan that spreads revenue evenly across 12 months will show a healthy year-end profit while hiding a Q1-Q4 cash crisis severe enough to default on loan payments. Lenders expect to see a monthly cash flow model with explicit off-peak assumptions. The fix: model minimum viable occupancy in October-March and size working capital to cover the trough.
- Ride count is set by vision rather than minimum viable admission pricing. A single-attraction site cannot justify a $25-$35 gate price that covers overheads. Opening with 3 or fewer rides creates a pricing-perception problem that is very hard to fix once the park is live. The standard rule of thumb among regional operators: you need at least 5 distinct ride or experience offerings to justify adult general admission above $20. Plan your ride acquisition in order of ROI per dollar spent, not in order of personal preference.
- ASTM F24 / ADIPS inspection costs are omitted from the financial model. Annual ride certification in the US costs $500-$5,000 per ride and is non-negotiable in 38 states. UK ADIPS DOC inspections cost £300-£1,200 per ride annually. A 10-ride park in the UK has minimum annual compliance spend of £3,000-£12,000 before any repairs or corrective actions. These costs appear in no generic business plan template and are regularly missed in first-draft models submitted to SBA lenders.
- Per-visitor ancillary spend is not modelled independently from admissions. Admission revenue on its own rarely produces a positive EBITDA at a small park. The unit economics model must show food, merchandise, premium experiences, and group event hire as separate revenue lines with independent margin assumptions. A plan that reports only "gate revenue × visitors" and claims 20% EBITDA will be immediately identified as unsophisticated by any experienced lender.
- Seasonal staffing cost spikes are not reflected in the payroll model. A park operating year-round with 15 permanent staff can require 120-180 seasonal employees in peak summer, an 8-12x payroll multiplier. Recruitment, training, uniforms, and safety certification for seasonal staff is a substantial cost that appears only in Q2-Q3 cash flows. First-time founders regularly understate this by 40-60% relative to what their operators eventually pay.
- UK planning permission timelines are treated as a formality rather than a constraint. Operators routinely underestimate the 8-24 month planning process, especially when an Environmental Impact Assessment is triggered for larger sites. Opening targets built around an 8-week planning window (the statutory minimum for minor developments) collapse when the LPA requests an EIA or when objections from neighbouring landowners extend the consultation. The fix: build your opening date from the planning grant date backwards, not from your desired season forwards.
How a Tennessee Operator Secured $4.2M to Build a Regional Outdoor Park, and Why the DSCR Calculation Was the Key
Marcus, a former hospitality and venue operations manager in Central Tennessee, approached Avvale with a clearly defined concept: an 8-acre outdoor park targeting families within a 90-minute drive of Nashville, with 7 rides, a splash pad, and a food village built around local BBQ vendors. He had a site under exclusivity, $1.2M in personal and family equity, and a strong operations background, but no business plan and no financial model.
The funding challenge was specific: the SBA lender needed to see a Debt Service Coverage Ratio of at least 1.25x under conservative assumptions. That meant the plan had to demonstrate that even at 65% of projected attendance, cash flow would cover the monthly loan payment. Our team built a full bespoke plan including: a ride-by-ride CAPEX schedule (sourced from three US ride suppliers, Zamperla, Fabbri Group, and Chance Rides), a phased construction timeline with planning and ASTM F24 certification milestones, monthly cash flow projections for Years 1-3, and a 5-year P&L and balance sheet. The model showed DSCR of 1.37x at 68% attendance, above the lender threshold.
Total raise: $4.2 million, comprising $1.5M founder and family equity, a $1.2M SBA 7(a) loan (NAICS 713110) secured through a regional Tennessee community bank, and $1.5M from a family office co-investor who took a minority equity stake. Break-even was modelled at month 22. The plan also included an investor summary deck, a 3-page executive summary formatted for the SBA lender's credit committee, and a risk register covering planning, weather, and ride downtime scenarios.
Composite based on real Avvale client outcomes. Name and identifying details changed for confidentiality.
Read more case studies from Avvale clients →Sample Business Plan Preview, What You Get From Avvale
Below is an extract from the executive summary of a theme park business plan written by our team. The numbers, structure, and language reflect what SBA lenders and private investors actually read in this niche.
Ridgeline Adventure Park, Nashville Metro, Tennessee
Ridgeline Adventure Park will open an 8-acre outdoor family theme park in Williamson County, Tennessee, serving the Nashville metropolitan catchment area of 2.4 million residents within a 90-minute drive. The park will operate 7 family and thrill rides, a 4,000 sq ft splash pad, and a curated food village with 4 local vendor concessions, targeting families with children aged 3-14 as its primary visitor segment.
Year 1 projects 72,000 visitors at 58% of design capacity, generating $3.24M in total revenue ($2.02M gate admissions, $1.01M food and beverage and merchandise, $210K corporate and school group hire). Year 3 projects 120,000 visitors at 82% capacity, $6.82M total revenue, EBITDA $1.50M (22%), after staffing, maintenance, insurance, debt service on a $1.2M SBA 7(a) loan at 6.5% over 20 years, and all fixed operating costs. Break-even is modelled at month 22 at 78,000 annual visitors.
Marcus [Founder], with 14 years in hospitality and venue operations including 6 years as Operations Director at a 1,200-seat event venue, will serve as CEO. The founding team brings full-time experience in construction project management, food and beverage operations, and digital marketing. The park will comply with Tennessee Department of Labor and Workforce Development amusement ride safety requirements, with all rides sourced from ASTM F24-certified manufacturers and subject to annual third-party inspection...
What's in the Theme Park Business Plan Template
Every Avvale business plan template includes these sections, pre-structured for your industry. The theme park template is configured for capital-intensive entertainment ventures, including ride CAPEX schedules and seasonal cash flow tables not found in generic templates.
- Executive Summary, Investment thesis, site and scale overview, funding ask, and projected DSCR, written to pass a lender's 5-minute pre-screen
- Company Overview, Legal structure, site description, catchment area analysis, and founding team credentials
- Industry Analysis, Theme park market size ($67.85B global, 6.3% CAGR), regional demand analysis, and competitive positioning framework
- Customer Analysis, Primary visitor segments (families, school groups, corporate events), visit frequency modelling, and willingness-to-pay benchmarks
- Competitor Analysis, Named competitive mapping of existing regional parks, drive-time substitutes, and your differentiation strategy (concept, theming, pricing, location)
- Operations Plan, Park layout, ride selection rationale, staffing pyramid (seasonal and permanent), daily operating protocols, and ASTM F24 / ADIPS compliance calendar
- Marketing Plan, Season pass pre-sale strategy, group sales programme, digital acquisition channels, and PR plan for opening day and annual ride launches
- Management Team, Founder and key hire biographies, advisory board, and any partnership agreements with ride suppliers or F&B operators
- Risk Register, Weather, ride downtime, planning delays, and seasonal attendance variance, with mitigations for each
The optional Financial Forecast add-on (included in our $300/£250 and $1,000/£800 packages) provides a full 5-year Excel model with: monthly cash flows for Years 1-2, annual P&L and balance sheet for Years 1-5, break-even analysis by attendance scenario, startup capital requirements table with funding sources, SBA lender summary page, and a ride-by-ride CAPEX depreciation schedule.

Frequently Asked Questions About Theme Park Business Plans
How much does it cost to open a theme park?
Is a theme park a profitable business?
What permits and licences do you need to open a theme park?
How long does it take to build and open a theme park?
What are the main revenue streams for a theme park?
How do theme parks attract investors?
What is the NAICS code for amusement and theme parks?
Get Your Theme Park Business Plan
Choose the level of support that fits your project stage and budget.
Theme Park Business Plan Template
Plug-and-play structure with ride CAPEX and seasonal cash flow tables. Write it yourself.

Market Research & Content
We handle research & narrative. Investor-ready copy with site-specific market analysis.
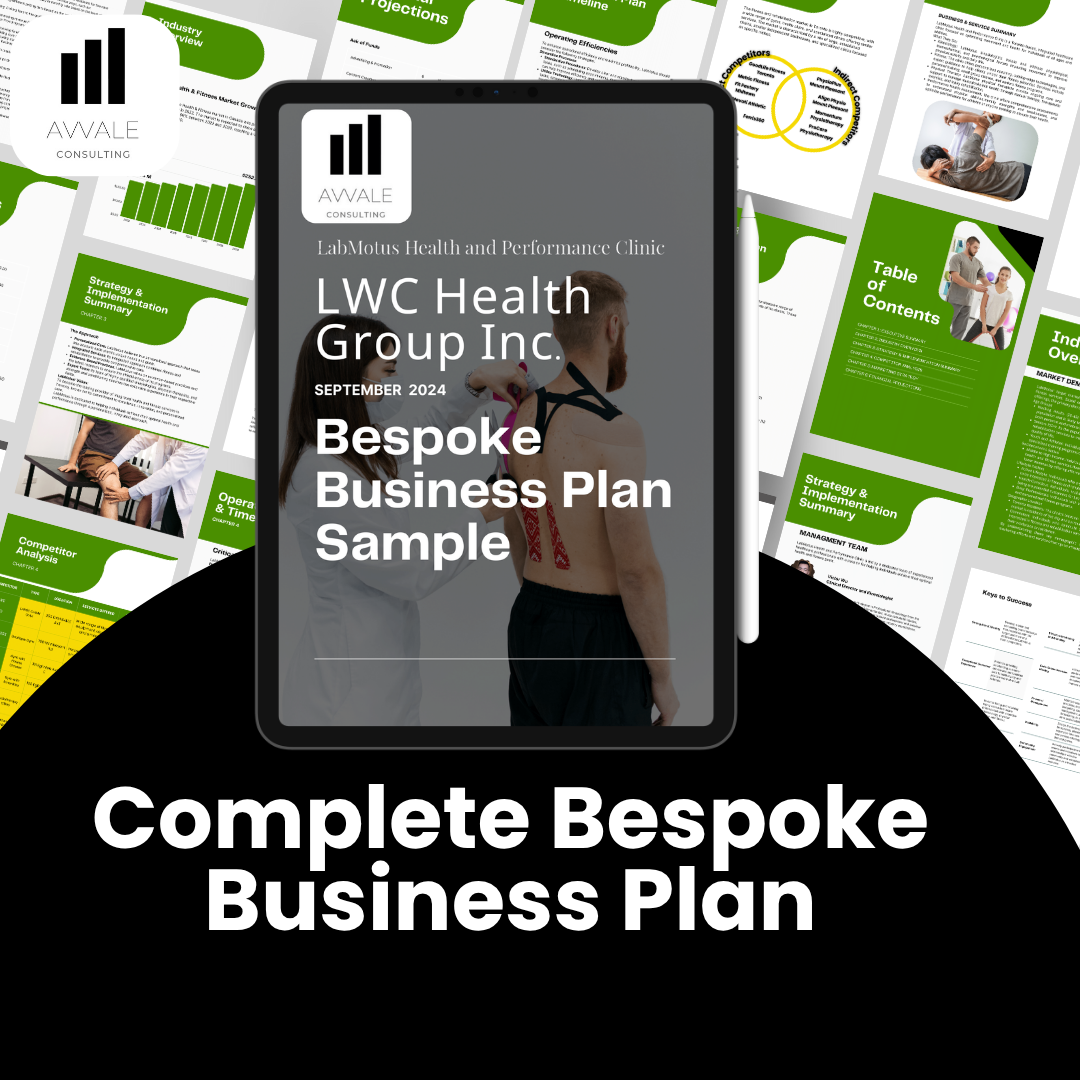
Bespoke Business Plan
Full plan + ride-by-ride CAPEX + 5-year forecast. SBA, bank & investor ready.