

Business Intelligence Platform Business Plan Template
Business Intelligence Platform Business Plan Template
A founder-focused business plan for BI and analytics platform startups — covering SOC 2 costs, seat-plus-consumption pricing, and the funding path from MVP to first enterprise logo.

Download Your Free Business Intelligence Platform Business Plan Template
DIY template with step-by-step instructions. Editable Word doc — yours in 30 seconds.
Launch Timeline & Milestones
Most first-time BI platform founders underestimate how long compliance and enterprise sales-readiness take relative to the engineering build. A realistic sequence looks like this:
- Months 1–2: Incorporate, open a business bank account, and start the SOC 2 readiness process in parallel with engineering — don't wait until the product is "done" to begin, since the audit's observation window alone takes 3–6 months.
- Months 2–4: Build the MVP: data-source connectors, a semantic/metrics layer, and a dashboarding UI covering the 3–5 chart types your target vertical actually uses (funnel, cohort, time-series, and a leaderboard/ranking view cover most B2B use cases).
- Months 4–6: Run a paid pilot with 3–5 design-partner customers at a discounted rate in exchange for weekly product feedback and a case-study commitment.
- Months 6–9: Formalise pricing (seat + consumption hybrid), hire a first sales or customer-success generalist, and complete the SOC 2 Type II audit so enterprise procurement teams stop blocking deals.
- Months 9–12: Close the first 20–40 paying logos, layer in usage-based overage billing, and start raising a seed round if the plan calls for outside capital rather than bootstrapped growth.
This sequencing matters more for BI platforms than most SaaS categories because the compliance gate (SOC 2) sits directly in the enterprise sales path — a plan that treats it as a "later" problem routinely adds two extra quarters to the first six-figure contract.
A useful way to pressure-test your own timeline is to work backwards from the first enterprise contract you actually want to close. If a target customer's procurement team requires a completed SOC 2 Type II report before they'll sign, and that report needs a minimum three-month observation window after your controls are in place, then your engineering and compliance workstreams need to start within weeks of each other — not sequentially. Founders who build first and bolt on compliance afterwards routinely discover that their architecture wasn't designed with audit logging, access controls, or encryption-at-rest baked in from day one, which means the "quick SOC 2 add-on" becomes a multi-month re-architecture instead.
The milestones above assume a lean team of two to four people. Solo founders should expect the same sequence to stretch by 30–50%, particularly around the pilot and sales-readiness phases, since there's no one dedicated to customer success while engineering continues. It's also worth building slack into the pilot phase specifically: design partners are valuable for product feedback, but they rarely convert to paying customers on the same terms you'll eventually charge full-price buyers, so don't let pilot economics anchor your pricing model in the business plan's financial projections.
What It Actually Costs to Build a BI Platform
Launching a business intelligence platform typically requires $20,000 to $175,000 (£16,000 to £138,000) before the first meaningful revenue lands, with the range driven almost entirely by how much of the semantic layer and connector library you build versus buy.
How startup capital is likely to be allocated
Funding Routes
In the US, SBA 7(a) loans (up to $5M, though most early-stage BI founders raise smaller amounts via SBA microloans or equipment financing) and pre-seed/seed venture capital are the two dominant paths. Y Combinator, Techstars, and vertical-focused accelerators regularly fund BI and analytics-layer startups at the pre-seed stage. In the UK, the Start Up Loans scheme (up to £25,000 at 6% fixed) covers early tooling costs, while SEIS/EIS-eligible angel and seed rounds are the more common route once a working product exists — SEIS Advance Assurance from HMRC is worth securing before approaching UK angel investors, since most won't invest without it.
Whichever route you take, lenders and investors will ask for the same thing: a 5-year financial model that separates seat revenue from usage-based revenue, and a cost base that reflects the SOC 2 and infrastructure spend above — not a generic SaaS template that ignores compliance costs.
One detail that surprises first-time BI founders: the cost of the SOC 2 audit itself is often smaller than the opportunity cost of the engineering time it consumes. Implementing access-control logging, vendor-risk management, incident-response documentation, and encryption-key rotation policies typically pulls 15–25% of engineering capacity for two to three months during the readiness phase. A realistic business plan budgets for this as a delay to feature velocity, not just a line item on the balance sheet — investors who have funded B2B SaaS before will specifically ask whether you've accounted for this trade-off, and a plan that hasn't thought it through signals inexperience.
Working capital planning also differs from a typical SaaS business because BI platforms often sign annual contracts paid upfront, which is a cash-flow advantage most generic templates don't model correctly. If 60% of your customer base pays annually in advance, your actual cash runway can be meaningfully longer than a monthly-recurring-revenue assumption would suggest — but only if your financial model accounts for deferred revenue recognition correctly, which is one of the more common technical errors in DIY business plans submitted to lenders.
Recommended Tech Stack
The build-vs-buy decision shapes your entire cost structure. Most successful BI platform founders buy the undifferentiated infrastructure layer and build only the parts that are actually the product:
- Data warehouse: Snowflake, Google BigQuery, or Amazon Redshift for the underlying storage and compute layer — almost never worth building in-house at seed stage.
- Ingestion/ETL: Fivetran or Airbyte for pre-built connectors to common data sources (Salesforce, Stripe, Postgres, Google Analytics), saving months of connector-maintenance work.
- Semantic/metrics layer: dbt (data build tool) for transformation and metric definitions — this is the layer most BI startups genuinely need to own and differentiate on.
- Visualization/charting: a custom React front-end using a charting library (Recharts, Nivo, or D3 directly) rather than embedding a third-party BI tool, since the dashboard UI is usually the product's core differentiator.
- Auth & billing: WorkOS or Auth0 for enterprise SSO/SAML (a hard requirement for SOC 2-conscious buyers), and Stripe Billing or Orb for the hybrid seat-plus-consumption pricing model.
- Compliance tooling: Vanta or Drata to automate SOC 2 evidence collection — these tools materially shorten the audit timeline and are worth the $5K-$15K/year cost given how much they compress the 6-12 month compliance runway.
Competing directly against Microsoft Power BI or Tableau on breadth is a losing strategy for a new entrant — both have decades of connector libraries and enterprise trust. The founders who win pick a vertical wedge (a specific workflow inside logistics, healthcare ops, or e-commerce) where a general-purpose tool is clunky, and out-execute on that one use case first.
A second decision that shapes engineering cost more than most founders expect is real-time versus batch data processing. Building a dashboard that refreshes every few seconds off a streaming pipeline (Kafka or a managed equivalent) is a meaningfully different — and more expensive — architecture than a nightly or hourly batch refresh through dbt. Most B2B use cases, including operations and finance dashboards, don't actually need sub-minute freshness; founders who default to real-time architecture because it "sounds more impressive" often burn 30–40% more engineering budget on infrastructure that customers never notice or ask for. The business plan should state explicitly which data-freshness tier the product targets and why, since this single decision cascades into hosting costs, team composition, and the SOC 2 scope.
On the AI front, natural-language query layers (ask a question in plain English, get a chart back) have become a genuine differentiator rather than a gimmick, particularly for self-service adoption among non-technical buyers. Implementing this well requires a well-structured semantic layer as a prerequisite — an AI query feature bolted onto messy, undocumented data models tends to produce confidently wrong answers, which is worse for trust than not having the feature at all. Founders building an MVP roadmap should sequence semantic-layer discipline before natural-language features, not the other way round.
| Business Model | Typical Buyer | Build Complexity |
|---|---|---|
| Standalone self-service BI | Ops, finance, or marketing team leads at SMB/mid-market companies | Moderate — connectors + dashboard UI, no OEM integration work |
| Embedded/OEM analytics | Product managers at other SaaS companies white-labelling analytics for their own customers | High — needs a robust API, multi-tenant theming, and usage-metering for OEM billing |
| Vertical operations intelligence | Ops leaders in a specific industry (logistics, healthcare, insurance) | Moderate-high — fewer generic connectors needed, but deep domain-specific data modelling |
Most first-time founders should start with either standalone self-service or vertical operations intelligence rather than embedded/OEM analytics, since the OEM path requires selling to other software companies — a fundamentally different (and typically slower, more technical) sales cycle than selling to an operations or finance buyer directly. Founders who pursue OEM analytics successfully almost always do so as a second product line after proving the core platform with direct customers first.
Need more than a template? We'll do the work for you.
Industry-specific structure. Write it yourself with expert guidance.
Download TemplateWe handle the research & narrative — investor-ready copy in 3–4 days
Get StartedFull plan + 5-year forecast, written by our team in 10–14 days
Book a CallCompliance: SOC 2, GDPR & ICO
Compliance is the single most underestimated line item in a BI platform business plan. Unlike a consumer app, a BI platform touches customer data directly — often their most sensitive operational metrics — so buyers scrutinise your compliance posture before signing.
United States
- SOC 2 Type II attestation — $15,000–$40,000 first year, 6–12 months including the 3–6 month observation window; effectively mandatory for deals above ~$15K ACV
- State business registration + EIN — $50–$500, 1–3 weeks
- Data Processing Agreement (DPA) templates for every customer contract
- CCPA/CPRA compliance program if serving California residents at scale — $2,000–$10,000, 4–8 weeks
- Cyber liability insurance
United Kingdom
- ICO data protection fee registration — £40–£60/year for most small BI SaaS controllers (Tier 1); same-day online registration
- UK GDPR compliance documentation; a Data Protection Officer is only mandatory if core activities involve large-scale monitoring of individuals
- Cyber Essentials certification — £300–£500 for self-assessment (1–4 weeks); Cyber Essentials Plus with on-site/remote audit runs £1,000–£5,000+ and is increasingly requested by enterprise UK buyers
- HMRC corporation tax registration and VAT registration if turnover exceeds £90,000
European Union
Under EU GDPR Article 27, a US or UK-based BI platform processing EU personal data without an EU establishment must appoint a named EU representative. Any transfer of EU customer data to US-based infrastructure also requires Standard Contractual Clauses (SCCs) built into your Data Processing Agreement.
It's worth separating two compliance concepts that founders frequently conflate: certifications that prove your own security posture (SOC 2, Cyber Essentials, ISO 27001) and legal obligations that govern how you handle other people's personal data (GDPR, CCPA). A BI platform needs both, because the product's entire value proposition depends on customers trusting you with their operational data — often including customer names, transaction values, and employee performance metrics that carry real regulatory weight if mishandled. A business plan that only addresses one half of this (usually the certification, because it's more visible in sales conversations) will read as incomplete to an experienced investor or enterprise security reviewer.
For founders building specifically for regulated verticals — healthcare, financial services, or public sector — additional frameworks apply on top of the baseline above: HIPAA in the US if handling protected health information, and either ISO 27001 or a sector-specific framework (such as FCA-aligned controls) for UK financial services customers. These add 3-6 months and a meaningfully higher compliance budget, and should be scoped explicitly in the business plan rather than left as a vague "we'll handle compliance as needed" statement, which is one of the fastest ways to lose credibility with a specialist investor.
Pricing & Unit Economics
Pure per-seat pricing is increasingly a mismatch for BI platforms, since usage (query volume, data rows scanned, dashboard refreshes) is a better proxy for value delivered than headcount. The dominant model in 2025-2026 is a hybrid seat-plus-consumption structure: a base platform fee, tiered per-seat licences (viewer vs. editor), and usage-based overage charges for heavy accounts.
Worked Example
A BI platform selling a $79/seat/month Editor tier and a $29/seat/month Viewer tier, where the average customer buys 4 Editor seats and 12 Viewer seats, generates $664/month per logo ($7,968 ACV). At 140 paying customers by month 18, that's approximately $1.12M ARR before usage-based overage revenue, which typically adds another 12–18% on top for data-heavy accounts that exceed their included query volume.
Gross margins for BI SaaS typically land between 70% and 85% once the data-warehousing layer is optimised (query caching and materialized views are the two biggest margin levers). Net margins are a slimmer 15–30% in years one and two, since sales and customer-success headcount grows ahead of ARR — CS is a particularly heavy early cost for BI tools because dashboard adoption requires hands-on onboarding that self-serve SaaS categories don't need.
Expansion revenue is where BI platforms typically outperform generic SaaS: once a customer's teams start relying on dashboards for daily decisions, seat expansion and usage growth within the same account often drives 25–40% of year-two revenue without any new-logo acquisition cost.
Choosing Between Freemium, Free Trial, and Sales-Led Pricing
BI platforms tend to split into three go-to-market models, and picking the wrong one for your target customer size is a common early misstep. A freemium model (unlimited viewers, capped editors or data sources) works well when the buyer is a small team that can self-serve a purchasing decision, and it compounds distribution through internal virality as more people inside an account get added as viewers. A time-limited free trial suits mid-market buyers who need to validate the tool against their own messy data before committing, but requires a genuinely fast time-to-value in the first session or the trial converts poorly. A sales-led, demo-first model is usually necessary once average contract value exceeds roughly $15,000-$20,000, because buyers at that price point expect a proof-of-concept period and multiple stakeholder sign-offs regardless of how good the self-serve experience is.
Many BI platforms blend these by using a free trial or limited freemium tier to generate inbound interest, then layering a sales-assisted onboarding motion once a prospect account shows genuine usage signals — dashboards created, data sources connected, and multiple team members logging in within the first two weeks are the strongest predictors of eventual conversion. A business plan aimed at investors should state which qualification signals the go-to-market motion is built around, since "we'll figure out the funnel later" is one of the more common reasons a promising BI platform business plan gets sent back for revision.
Market Size & Competitive Landscape
The global business intelligence market was valued at $29.42 billion in 2024 and is projected to grow at roughly 10.3% CAGR through 2030, according to Grand View Research. Separately, Fortune Business Insights puts combined global BI and analytics software spend at approximately $33.3 billion in 2025, reflecting continued enterprise investment in self-service analytics tooling.
BI market size and growth at a glance
Where New Entrants Actually Win
The competitive landscape has three distinct layers, and confusing them is the most common positioning mistake in BI platform business plans:
- Enterprise incumbents: Microsoft Power BI, Tableau (Salesforce), and Looker (Google Cloud) — dominant on breadth, bundled into existing enterprise agreements, and effectively free at the margin for customers already paying for Microsoft 365 or Salesforce.
- Mid-market self-service tools: Sisense, Domo, and Qlik — compete on faster time-to-dashboard and lighter IT overhead than the enterprise incumbents, but still general-purpose.
- Modern/AI-native entrants: ThoughtSpot and a wave of newer natural-language-query tools — compete on ease of use for non-technical business users rather than analyst-driven dashboard building.
A new BI platform rarely wins by competing on breadth against Power BI or Tableau. The businesses that actually close six-figure ARR in year one pick a specific vertical workflow — claims analytics for insurance ops, route intelligence for logistics, cohort analytics for subscription commerce — where the incumbents' general-purpose dashboards require weeks of custom configuration that a purpose-built tool skips entirely.
Regional Demand Patterns
Enterprise BI adoption is heavily concentrated in a handful of metro clusters, and a founder's go-to-market plan should reflect where the buyers actually are rather than assuming demand is evenly distributed. In the US, the San Francisco Bay Area, New York, and Austin account for a disproportionate share of Series A-to-C SaaS buyers who purchase specialist BI tools, largely because those markets have the highest density of data teams with budget authority. In the UK, London remains the dominant hub for BI purchasing decisions, though Manchester, Leeds, and Edinburgh have growing clusters of mid-market SaaS and fintech buyers who are increasingly willing to adopt vertical-specific analytics tools over generic dashboards, partly driven by cost sensitivity relative to London-based enterprise pricing.
For founders targeting a specific vertical rather than a specific geography, industry conferences and trade-association memberships tend to outperform generic digital marketing for the first 20-30 customers, since BI buyers in a niche vertical (logistics, insurance, healthcare operations) trust peer referrals over cold outbound far more than general SaaS buyers do. A go-to-market section that names the specific trade shows, Slack communities, or association memberships the founder plans to use is materially more credible to an investor than a generic "content marketing and SEO" plan.
Internationally, Canada, Australia, and the UAE all have growing BI adoption curves worth noting in an international-expansion section, even if year-one focus stays domestic. Canadian mid-market buyers increasingly look for GDPR-adjacent privacy assurances even outside the EU due to provincial privacy law alignment; Australian buyers weight local data-residency options heavily given the concentration of cloud infrastructure providers now offering Sydney-region hosting; and UAE enterprise buyers, particularly in Dubai's logistics and financial-services sectors, represent a fast-growing but still underserved market for vertical-specific BI tools relative to the density of generic BI vendor coverage there.
5 Mistakes That Kill BI Platform Startups
- Underestimating data-warehousing costs as usage scales. The free-tier or low-volume pricing on Snowflake/BigQuery/Redshift looks trivial in an MVP budget, then becomes a real cost centre once customers run queries against millions of rows daily. Model this explicitly rather than treating cloud infrastructure as a rounding error.
- Pricing purely per-seat when the market wants consumption pricing. Buyers increasingly expect BI tools to charge based on data volume or query usage, not just headcount. A seat-only model caps expansion revenue and creates awkward conversations when a 5-seat customer runs 10x the query volume of a 20-seat customer.
- Starting SOC 2 too late. Founders who wait until an enterprise deal is stuck in security review to begin the SOC 2 process routinely lose 2 or more quarters. Start the readiness process alongside — not after — the MVP build.
- Building a general-purpose tool instead of a vertical wedge. Competing head-on with Power BI or Tableau on breadth is a losing strategy for a small team; the founders who win pick one workflow in one vertical and become unambiguously better at that single use case.
- No dedicated customer-success function once paying customers arrive. Dashboard adoption is not self-serve the way many SaaS categories are — customers need help defining their first metrics and building trust in the data. Underinvesting in onboarding shows up later as churn, not as an obvious early red flag.
Each of these mistakes shares a common root cause: treating a BI platform as a generic SaaS build rather than a category with its own specific cost structure, sales cycle, and trust requirements. The founders who avoid these traps tend to have either direct experience buying enterprise BI tools themselves (as a data analyst, ops lead, or finance manager) or they deliberately recruit an advisor with that background before finalising the product roadmap. A business plan that names a specific advisor or early hire with relevant enterprise-buyer experience is a meaningfully stronger signal to investors than one that treats "we'll learn as we go" as an acceptable answer to the go-to-market question.
It's also worth flagging a sixth, less obvious mistake that experienced BI operators watch for: over-indexing on dashboard aesthetics at the expense of data accuracy. A visually polished chart built on a stale or incorrectly joined data pipeline erodes trust faster than an ugly chart built on reliable data — and once a customer catches one wrong number, they tend to question every subsequent number the platform shows them, regardless of how the underlying pipeline was actually fixed. Founders should budget explicit QA time for data validation before every customer-facing release, not just for feature completeness.
Sample Business Plan Preview
Preview the structure and financial outputs a buyer receives. These visual mockups are generated from the same assumptions used throughout this page.
Northline Analytics
Northline is a business intelligence platform built for logistics operators, launched from Manchester with a vertical-specific dashboard suite and a clear seed-funding plan.
What's in the Template
Every Avvale business plan template includes these sections, pre-structured for your industry:
- Executive Summary — Your business at a glance, written to hook investors in 60 seconds
- Company Overview — Legal structure, ownership, location, and founding story
- Industry Analysis — Market size, growth trends, and regulatory landscape
- Customer Analysis — Target buyer personas, pain points, and buying triggers
- Competitor Analysis — Vendor-layer mapping and your differentiation strategy
- Marketing Plan — Channels, messaging, and customer acquisition strategy
- Operations Plan — Engineering roadmap, compliance milestones, and staffing plan
- Management Team — Founder bios, advisory board, and key hires planned
The optional Financial Forecast add-on (included in our $300/£250 and $1,000/£800 packages) provides a 5-year Excel model with income statement, cash flow, balance sheet, break-even analysis, and startup capital requirements — built to separate seat revenue from usage-based revenue so it holds up under investor and lender scrutiny.
Looking for a broader SaaS structure rather than a BI-specific plan? See our SaaS business plan template or the closely related data visualization tools business plan template.
How a First-Time Founder Raised £180K by Repositioning a Generic Dashboard Tool
A Manchester-based founder with a background as a data analyst approached Avvale with an early BI dashboard product aimed at "any business that wants better data." The positioning wasn't landing with investors, who kept comparing it unfavourably to Power BI. We rebuilt the plan around a vertical-specific angle — operations intelligence for logistics companies — with a 5-year financial model separating seat and consumption revenue, a staged SOC 2 timeline, and named competitive positioning against the incumbent BI vendors. The sharper plan helped close a £180,000 seed round and three enterprise pilot agreements within the following quarter. Investor feedback specifically cited the staged SOC 2 timeline and the segmentation between platform-fee, seat, and consumption revenue as the difference between a plan that "sounded like every other BI pitch" and one that demonstrated the founder actually understood how enterprise buyers evaluate and budget for analytics tools.
Composite based on real Avvale client outcomes. Name and identifying details changed for confidentiality.
Read more case studies →
Frequently Asked Questions
How much does it cost to build a business intelligence platform?
What is the difference between embedded BI and standalone BI?
Is business intelligence software profitable as a startup?
Do I need SOC 2 to sell BI software to enterprise customers?
What is the average revenue per customer for a BI SaaS company?
How long does Cyber Essentials certification take for a UK BI startup?
Get Your Business Intelligence Platform Business Plan
Choose the level of support that fits your stage and budget.
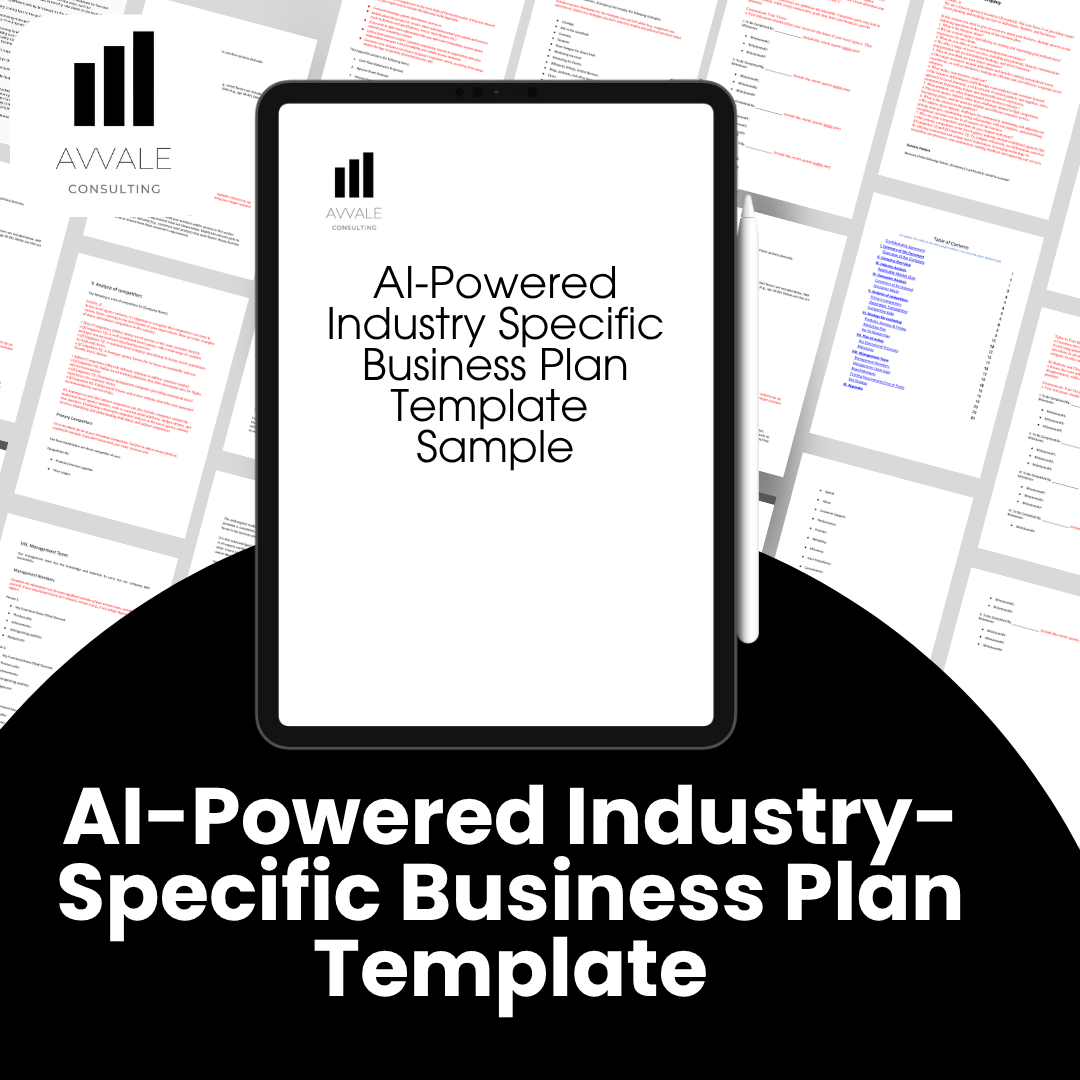
Business Intelligence Platform Business Plan Template
Plug-and-play structure. Ideal if you want to write it yourself.

Market Research & Content
We handle research & narrative. You get investor-ready copy.
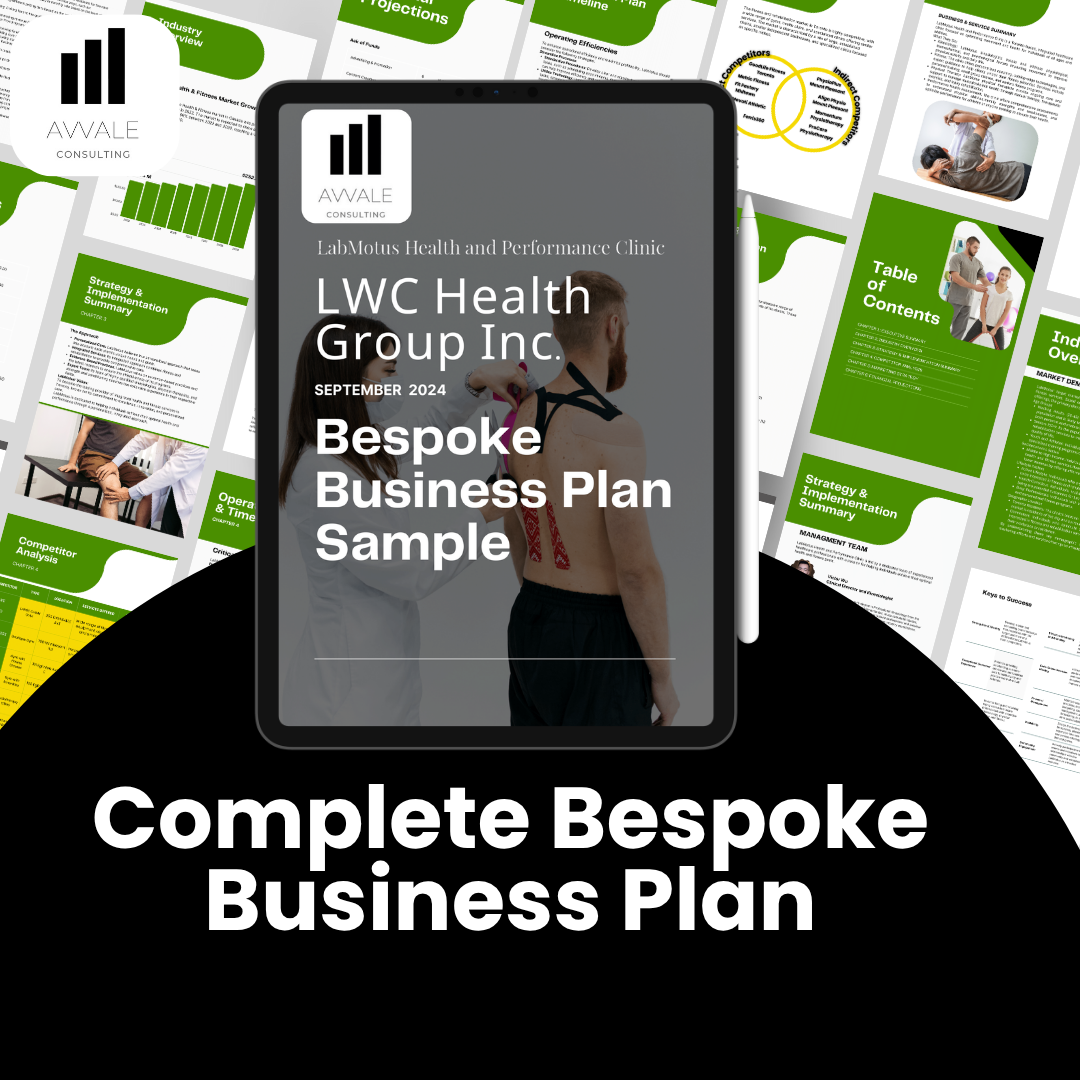
Bespoke Business Plan
Full plan + 5-year forecast. SBA, bank loan & investor ready.
Useful Links & Resources
Explore more Avvale resources for technology founders: